Trade Smarter with MXWLL Indicators
Turn insights into action with tools designed for precision, profitability, and ease.
Access the Tools the Pros Use.
Everything You Need to Excel in One Powerful Package
Ultimate Trading Bundle
How It Works:
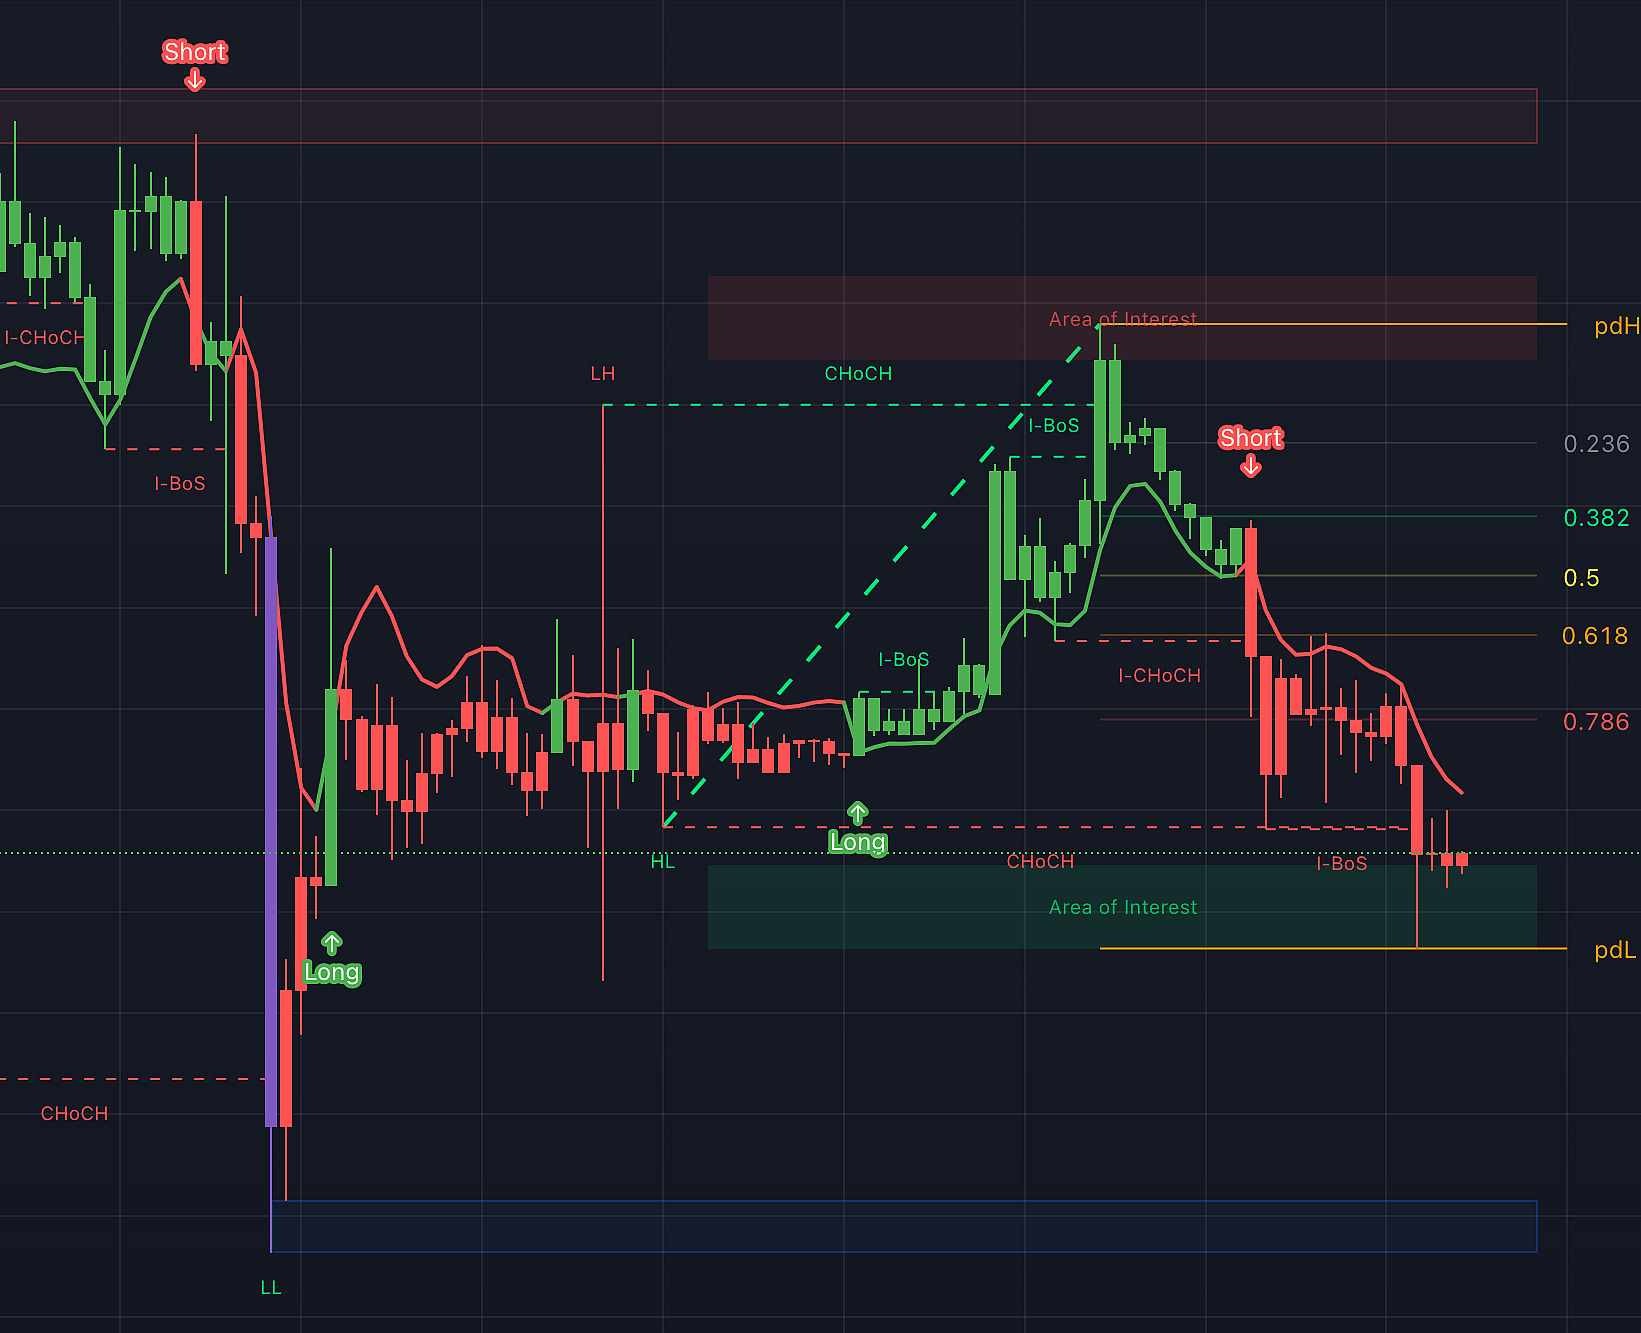
The Mxwll OptAlgo uses a combination of the M-Swift Average and M-Smooth Average to form a responsive, volume-weighted moving average. It adapts to high-volume breakouts and consolidations, ensuring timely entry and exit signals.
Trend-Following Strategy: Tracks trends using crossovers between the OptAlgo line and price.
Reversal Trading: AI-driven countertrend channels predict likely reversal points.
Market Crash Shorting: Detects strong downside momentum for short opportunities.
Reversal Trading: AI-driven countertrend channels predict likely reversal points.
Market Crash Shorting: Detects strong downside momentum for short opportunities.
How to Set It Up:
- Add Mxwll OptAlgo to your TradingView chart.
- Adjust settings for M-Swift and M-Smooth averages to match your trading style.
- Use the default take-profit and stop-loss settings for risk management or customize based on asset volatility.
- Watch for crossovers: green for trend confirmation, red for potential reversals.
- Enable alerts for automated signal notifications.
How It Works:
The Mxwll RSI improves on the traditional RSI by integrating OBV (On-Balance Volume) weighting and a smoothed Hull Moving Average. This combination reduces noise and enhances clarity in trends. Overbought and oversold signals are highlighted, with clear visual cues for reversals, making it easier to spot opportunities.
Trend Clarity: The RSI sustains its direction during strong trends, reducing confusion from choppy price action.
Volume Sensitivity: Weighted by OBV, it reacts quicker to high-volume movements, providing earlier signals.
Countertrend Trading: Extreme overbought/oversold values are paired with visual arrows to signal potential reversals.
Volume Sensitivity: Weighted by OBV, it reacts quicker to high-volume movements, providing earlier signals.
Countertrend Trading: Extreme overbought/oversold values are paired with visual arrows to signal potential reversals.
How to Set It Up:
- Add Mxwll RSI to your TradingView chart.
- Adjust the HMA Length for your desired smoothness.
- Set the RSI Period to refine signal sensitivity.
- Use the overbought/oversold thresholds (-20/20) and extreme thresholds (-35/35) to identify reversal zones.
- Follow the green and red arrows for optimal entry and exit points.
How It Works:
The Liquidation Suite gathers data directly from exchange order books, including bids, asks, leverage, and liquidation metrics. Unlike other indicators that rely on estimates, it provides precise levels and heatmaps to identify where market participants are likely to face liquidation, creating high volatility zones.
Heatmaps: Highlight areas with the highest concentration of liquidation risk.
Leverage Levels: Breaks down key levels (25x, 50x, 100x) to pinpoint entry and exit opportunities.
Bid/Ask Metrics: Shows the net position delta and order flow to guide trades.
How to Set It Up:
- Add the Liquidation Suite to your TradingView chart.
- Select the asset and timeframe you want to analyze.
- Use heatmaps to spot high-risk zones for potential volatility.
- Adjust the number of liquidation levels and leverage ratios to match your strategy.
- Combine with other indicators for enhanced precision.
Our Tools - Your Edge
Trade with confidence using our skillfully crafted indicators. Maximize your gains and turn confusion into clarity with our tried-and-true tactics. Start trading today and take the first step towards achieving your financial goals.
Don't just take our word for it
From Frustration to Mastery
Do these challenges sound familiar?
Doubting your trades and missing wins
The despair of losses and market unpredictability
Emotional trading and missed opportunities
The despair of losses and market unpredictability
Emotional trading and missed opportunities
It’s Time for a Change.
Access the Tools the Pros Use.
Everything You Need to Excel in One Powerful Package
Ultimate Trading Bundle
Frequently asked questions
What indicators does Mxwll offer?
Mxwll offers both free and Pro indicators to suit a wide range of trading needs:
Free Indicators:
- SPX Mapped Gaps: Maps SPX gaps as potential support/resistance levels.
- Liquidation Risk Suite: Optimizes position sizing and liquidation insights.
- The Next Pivot: Forecasts pivot points based on historical data.
- Pivot Profit Target: Sets realistic profit targets using recent pivot highs/lows.
- Mxwll Price Action Suite: Combines SMC with advanced rolling price action analysis.
- Genuine Liquidation Delta: Tracks real liquidation data for 100+ cryptocurrencies.
- Trended CVD: Highlights volume delta trends and divergences.
- Crypto/DXY Scoring: Compares crypto strength against DXY or other assets.
- Market Sessions and TPO: Visualizes session data with TPO profiles and forecasts.
- MTF Key Levels: Identifies multi-timeframe support/resistance zones.
Pro Indicators:
- Mxwll OptAlgo: Combines advanced moving averages to identify trends, reversals, and market crashes with precision.
- Mxwll RSI: An enhanced RSI that provides smoother outputs, volume weighting, and actionable countertrend trading opportunities.
- Mxwll Liquidation Suite: Offers the most accurate liquidation ranges, heatmaps, and leverage data by using level 2 metrics.
Mxwll offers both free and Pro indicators to suit a wide range of trading needs:
Free Indicators:
- SPX Mapped Gaps: Maps SPX gaps as potential support/resistance levels.
- Liquidation Risk Suite: Optimizes position sizing and liquidation insights.
- The Next Pivot: Forecasts pivot points based on historical data.
- Pivot Profit Target: Sets realistic profit targets using recent pivot highs/lows.
- Mxwll Price Action Suite: Combines SMC with advanced rolling price action analysis.
- Genuine Liquidation Delta: Tracks real liquidation data for 100+ cryptocurrencies.
- Trended CVD: Highlights volume delta trends and divergences.
- Crypto/DXY Scoring: Compares crypto strength against DXY or other assets.
- Market Sessions and TPO: Visualizes session data with TPO profiles and forecasts.
- MTF Key Levels: Identifies multi-timeframe support/resistance zones.
Pro Indicators:
- Mxwll OptAlgo: Combines advanced moving averages to identify trends, reversals, and market crashes with precision.
- Mxwll RSI: An enhanced RSI that provides smoother outputs, volume weighting, and actionable countertrend trading opportunities.
How do I access these indicators?
Free Indicators: Create a TradingView account and add the free indicators directly from the Mxwll TradingView page. No permissions are required.
Pro Indicators: Purchase the Pro plan and provide your TradingView username during signup. The Pro indicators are activated within 24 hours using "Submit on Sign Up" permissions.
Pro Indicators: Purchase the Pro plan and provide your TradingView username during signup. The Pro indicators are activated within 24 hours using "Submit on Sign Up" permissions.
Are the indicators user-friendly?
Absolutely! Both free and Pro indicators are designed to be intuitive and user-friendly. Each indicator includes tutorials and documentation to help traders of all levels integrate them seamlessly into their strategies.
What makes Mxwll Pro indicators unique?
Mxwll Pro indicators are built with cutting-edge algorithms and tested extensively for reliability.
- OptAlgo: Delivers trend-following signals with predictive channels and AI-driven reversals.
- RSI: Provides smooth, volume-weighted signals for precise countertrend trading.
- Liquidation Suite: Offers unparalleled accuracy by using data outside of TradingView to track real liquidation metrics, heatmaps, and bid/ask ratios.
Mxwll Pro indicators are built with cutting-edge algorithms and tested extensively for reliability.
- OptAlgo: Delivers trend-following signals with predictive channels and AI-driven reversals.
- RSI: Provides smooth, volume-weighted signals for precise countertrend trading.
Can I use these indicators with any trading strategy?
Yes, the indicators are designed to support various strategies:
- Trend-following: OptAlgo and RSI excel in identifying trends.
- Reversal trading: RSI and AI-powered OptAlgo provide strong countertrend signals.
- Scalping and day trading: The Liquidation Suite pinpoints high-liquidity zones for rapid trade setups.
How accurate are these indicators?
All indicators are extensively tested across multiple assets and timeframes. For example, the Mxwll Liquidation Suite uses level 2 data to ensure precise identification of critical price zones, while the OptAlgo delivers consistent results through trend-following strategies.
How does the Mxwll OptAlgo work?
The OptAlgo integrates M-Swift and M-Smooth averages to provide a combined moving average that adapts to both trending and ranging markets. It identifies strong price movements to trigger buy/sell signals, ensuring you capitalize on major trends.
What makes the Mxwll RSI better than traditional RSI?
The Mxwll RSI is volume-weighted and smoother than traditional RSI, reducing lag and providing clearer overbought/oversold signals. Its multi-timeframe functionality allows it to adapt to various trading strategies while offering precise countertrend trading opportunities.
What makes the Mxwll RSI better than traditional RSI?
Unlike other indicators, the Mxwll Liquidation Suite pulls liquidation levels, bid/ask ratios, and leverage data from outside TradingView, offering unparalleled accuracy. Its heatmaps highlight high-risk zones, making it essential for crypto traders.
What data does the Mxwll Liquidation Suite use?
Unlike other indicators, the Mxwll Liquidation Suite pulls liquidation levels, bid/ask ratios, and leverage data from outside TradingView, offering unparalleled accuracy. Its heatmaps highlight high-risk zones, making it essential for crypto traders.
1 on 1 Coaching
Accelerate your growth with tailored coaching designed for traders of all levels. Our experienced coaches provide actionable insights to help you improve performance and confidence.

Created with